Amazon QuickSight – Order of Evaluation
When opening or updating an analysis, Amazon QuickSight evaluates all configurations within the analysis in a specific sequence before displaying it. Amazon QuickSight translates the configuration into a query that a database engine can execute. The query returns the data consistently, regardless of whether you connect to a database, a Software as a Service (SaaS) source, or the Amazon QuickSight analytics engine (SPICE).
Understanding the evaluation order helps you know the sequence that dictates when a specific filter or calculation is applied to your data.
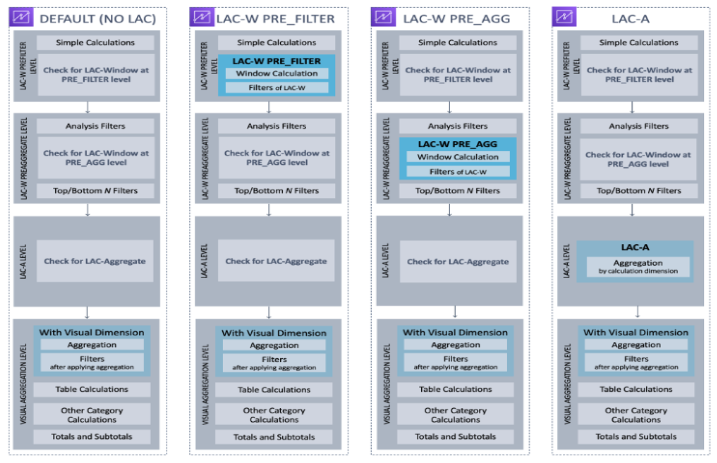
The following illustration shows the evaluation order.
The left column displays the order of evaluation when no level aware calculation window (LAC-W) or aggregate (LAC-A) function is involved.
The second column shows the evaluation order for analyses containing calculated fields to compute LAC-W expressions at the prefilter (PRE_FILTER) level.
The third column displays the evaluation order for analyses containing calculated fields to compute LAC-W expressions at the preaggregate (PRE_AGG) level.
The last column presents the evaluation order for analyses containing calculated fields to compute LAC-A expressions.
A more detailed explanation of the evaluation order follows the illustration.
The following list outlines the sequence in which Amazon QuickSight applies the configuration within your analysis. Configurations set up in your dataset, such as calculations at the dataset level, filters, and security settings, occur outside your analysis and apply to the underlying data. The list below only covers what happens inside the analysis:
- LAC-W Prefilter level: This step evaluates the data based on the original table cardinality before applying any analysis filters.
- Simple calculations: These are scalar-level calculations that do not involve aggregations or window calculations. Examples include date_metric/60, parseDate(date, ‘yyyy/MM/dd’), ifelse(metric > 0, metric, 0), and split(string_column, ‘|’ 0).
- LAC-W function PRE_FILTER: If a visual includes any LAC-W PRE_FILTER expressions, Amazon QuickSight first computes the window function at the original table level before applying any filters. If the LAC-W PRE_FILTER expression is utilized in filters, it is applied at this stage. For instance, maxOver(Population, [State, County], PRE_FILTER) > 1000.
- LAC-W PRE_AGG: This step evaluates the data based on the original table cardinality before applying any aggregations.
- Filters added during analysis: Filters created for un-aggregated fields in the visuals are applied at this stage, resembling WHERE clauses. For instance, year > 2020.
- LAC-W function PRE_AGG: If a visual involves any LAC-W PRE_AGG expressions, Amazon QuickSight computes the window function before applying any aggregations. If the LAC-W PRE_AGG expression is used in filters, it is applied at this stage. For example, maxOver(Population, [State, County], PRE_AGG) > 1000.
- Top/bottom N filters: These filters are configured on dimensions to display the top/bottom N items.
- LAC-A level: Assess aggregations at a customized level before visual aggregations
- Custom-level aggregations: If a visual involves any LAC-A expressions, they are calculated at this stage. Amazon QuickSight computes the aggregation, grouped by the dimensions specified in the calculated fields, using the table after applying the previously mentioned filters. For instance, max(Sales, [Region]).
- Visual level: Evaluates aggregations at the visual level and performs post-aggregation table calculations, with the remaining configurations applied in the visuals
- Visual-level aggregations: These should always be applied, except for tabular tables (where the dimension is empty). With this setting, aggregations based on fields in the field wells are calculated, grouped by the dimensions placed in the visuals. If any filter is built on top of aggregations, it is applied at this point, similar to HAVING clauses. For example, min(distance) > 100.
- Table calculations: If a visual references any post-aggregation table calculation (which should take an aggregated expression as an operand), it is calculated at this point. Amazon QuickSight performs window calculations after visual aggregations. Similarly, filters built on such calculations are applied.
- Other category calculations: This type of calculation is only present in line/bar/pie/donut charts. For more information, see Display limits.
- Totals and subtotals: Totals and subtotals are calculated in donut charts (only totals), tables (only totals), and pivot tables, if requested.