Kubernetes – Monitoring
We have a bunch of tools for monitoring large clusters.
Monitoring with Prometheus
In 2012, SoundCloud opened sourced this monitoring and alerting system. It handles multi-dimensional data very well.
There are multiple components in Prometheus that participate in monitoring
- Prometheus − Scraping and storing data are its core functions.
- Prometheus node explore − Exposes the host level matrices to Prometheus.
- Ranch-eye − Is a haproxy that exposes Prometheus stats from cAdvisor.
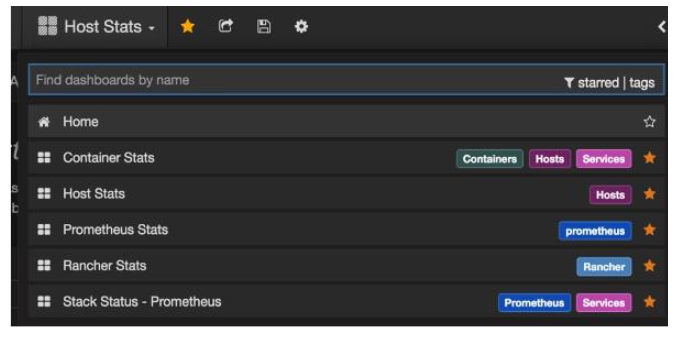
- Grafana − Data visualization.
- InfuxDB − Rancher-specific time series database.
- Prom-ranch-exporter − This is a simple node.js application that queries Rancher server for stack status.
Sematext Docker Agent
Modern metrics, events, and log collection agent for Docker. On every Docker host, it collects logs, metrics, and events for all cluster nodes. The system discovers all containers (one pod may contain multiple containers), including containers for Kubernetes core services if they are deployed as Docker containerscontainers. After its deployment, all logs and metrics are immediately available out of the box.
Deploying Agents to Nodes
DeamonSets ensure pods get added to the cluster in Kubernetes.
SemaText Docker Agent configuration
Environment variables control it.
- Sign up for a free account at apps.sematext.com .
- In order to obtain the SPM App Token, you must create an SPM App of type “Docker”. The SPM App will store your Kubernetes performance metrics and events.
- Make a Logsene App to get your Logsene App Token. Logsene App will hold your Kubernetes logs.
- Change the values of LOGSENE_TOKEN and SPM_TOKEN in the DaemonSet definition.
- Get the latest sematext-agent-daemonset.yml (raw plain-text) template (also below).
- Put it somewhere.
- Please replace SPM_TOKEN and LOGSENE_TOKEN placeholders with your SPM and Logsene App tokens.
Create DaemonSet Object
apiVersion: extensions/v1beta1
kind: DaemonSet
metadata:
   name: sematext-agent
spec:
   template:
      metadata:
         labels:
            app: sematext-agent
      spec:
         selector: {}
         dnsPolicy: "ClusterFirst"
         restartPolicy: "Always"
         containers:
         - name: sematext-agent
            image: sematext/sematext-agent-docker:latest
            imagePullPolicy: "Always"
            env:
            - name: SPM_TOKEN
               value: "REPLACE THIS WITH YOUR SPM TOKEN"
            - name: LOGSENE_TOKEN
               value: "REPLACE THIS WITH YOUR LOGSENE TOKEN"
            - name: KUBERNETES
               value: "1"
            volumeMounts:
               - mountPath: /var/run/docker.sock
                  name: docker-sock
               - mountPath: /etc/localtime
                  name: localtime
            volumes:
               - name: docker-sock
                  hostPath:
                     path: /var/run/docker.sock
               - name: localtime
                  hostPath:
                     path: /etc/localtime
Running the Sematext Agent Docker with kubectl
$ kubectl create -f sematext-agent-daemonset.yml
daemonset "sematext-agent-daemonset" created
Kubernetes Log
A Kubernetes container’s logs aren’t much different from a Docker container’s. However, Kubernetes users have to look at pod logs. It’s useful to have Kubernetes-specific information available for log searches, like −
- Kubernetes namespace
- Kubernetes pod name
- Kubernetes container name
- Docker image name
- Kubernetes UID
Using ELK Stack and LogSpout
To collect and forward the logs to the logging platform, we’ll use LogSpout (though there are other options such as FluentD).
In the following code, we show how to set up ELK cluster on Kubernetes and how to create ElasticSearch services.
apiVersion: v1
kind: Service
metadata:
   name: elasticsearch
   namespace: elk
   labels:
      component: elasticsearch
spec:
   type: LoadBalancer
   selector:
      component: elasticsearch
   ports:
   - name: http
      port: 9200
      protocol: TCP
   - name: transport
      port: 9300
      protocol: TCP
Creating Replication Controller
apiVersion: v1
kind: ReplicationController
metadata:
   name: es
   namespace: elk
   labels:
      component: elasticsearch
spec:
   replicas: 1
   template:
      metadata:
         labels:
            component: elasticsearch
spec:
serviceAccount: elasticsearch
containers:
   - name: es
      securityContext:
      capabilities:
      add:
      - IPC_LOCK
   image: quay.io/pires/docker-elasticsearch-kubernetes:1.7.1-4
   env:
   - name: KUBERNETES_CA_CERTIFICATE_FILE
   value: /var/run/secrets/kubernetes.io/serviceaccount/ca.crt
   - name: NAMESPACE
   valueFrom:
      fieldRef:
         fieldPath: metadata.namespace
   - name: "CLUSTER_NAME"
      value: "myesdb"
   - name: "DISCOVERY_SERVICE"
      value: "elasticsearch"
   - name: NODE_MASTER
      value: "true"
   - name: NODE_DATA
      value: "true"
   - name: HTTP_ENABLE
      value: "true"
ports:
- containerPort: 9200
   name: http
   protocol: TCP
- containerPort: 9300
volumeMounts:
- mountPath: /data
   name: storage
volumes:
   - name: storage
      emptyDir: {}
Kibana URL
Kibana gets the Elasticsearch URL from an environment variable.
- name: KIBANA_ES_URL
value: "http://elasticsearch.elk.svc.cluster.local:9200"
- name: KUBERNETES_TRUST_CERT
value: "true"
You’ll be able to access Kibana’s UI at container port 5601 and the corresponding host/node port combination. When you start, Kibana won’t have any data (which is expected since no data has been pushed yet).