
Power BI – Connect to Data
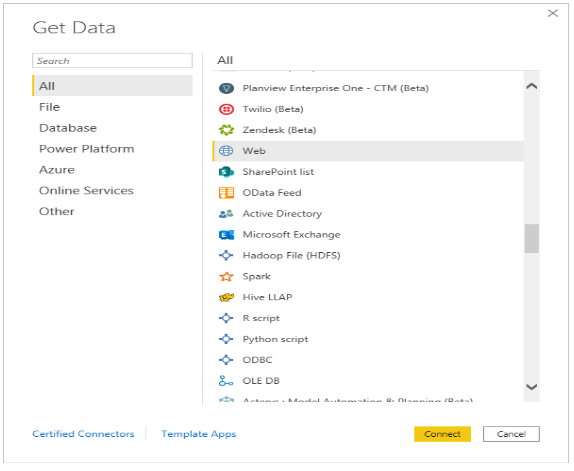
To connect to the data and to see the many types of data sources available, select Get Data > More on the Power BI Desktop Home tab, then scroll through All data sources in the Get Data window.
Connecting to different Web data sources

Let us consider some random data from The Bankrate.com Best and worst states for retirement
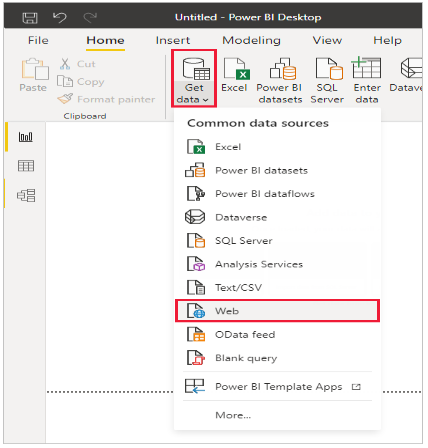
Select Get Data > Web from the Power BI Desktop Home tab.

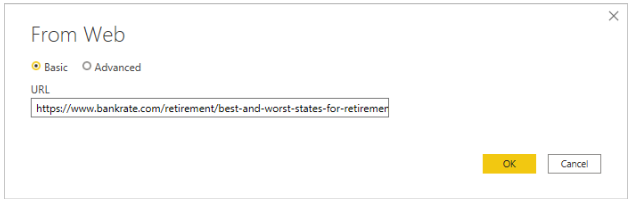
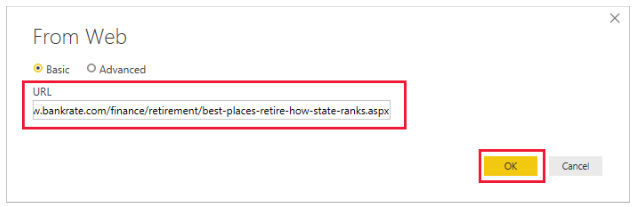
In the From Web dialog box, paste the address https://www.bankrate.com/retirement/best-and-worst-states-for-retirement/ into the URL field, and select OK.

In case you receive a prompt, choose Connect to utilize anonymous access on the Access Web Content screen.
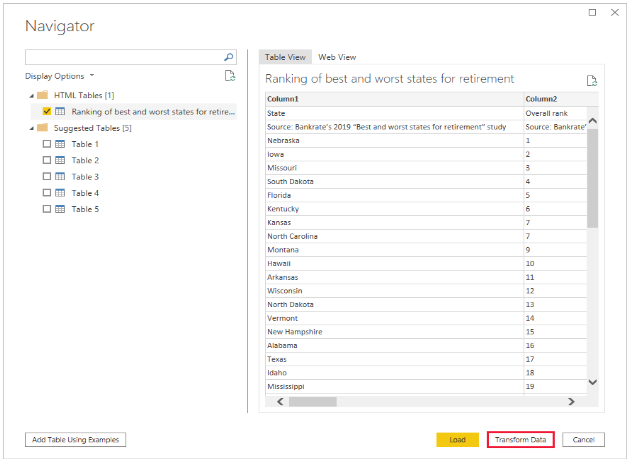
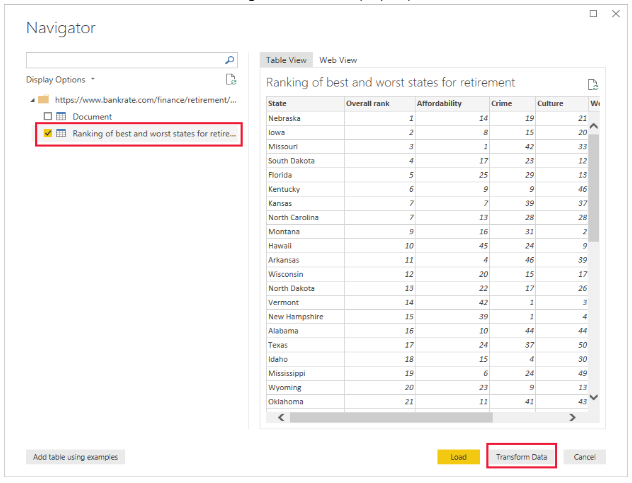
Power BI Desktop employs its query functionality and reaches out to the web resource. The Navigator window presents the results it discovered on the webpage, including an HTML table labeled “Ranking of best and worst states for retirement,” along with five other proposed tables. As the HTML table is of interest, click on it to view a preview.
Now you have the option to Load the table or Transform data to make modifications to the table prior to loading it.

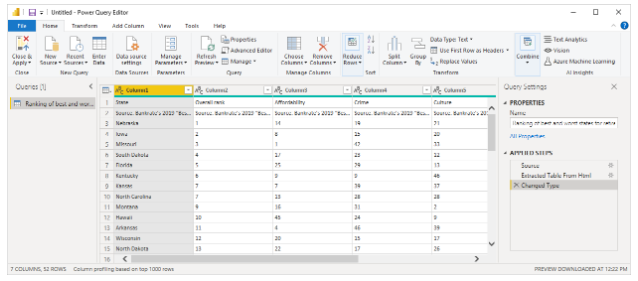
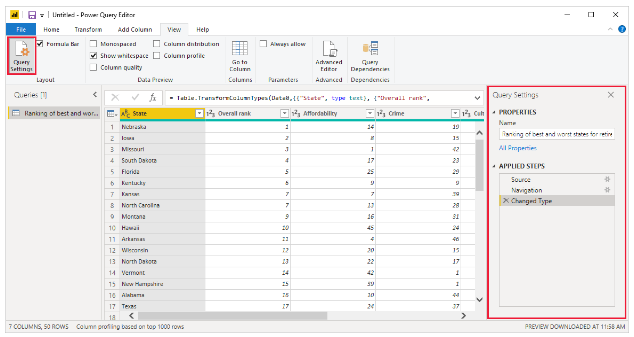
A representative view of the table appears when you select Transform data in Power Query Editor. By selecting Query Settings on the View tab of Power Query Editor, you can always see the Query Settings pane on the right.

Example of connecting to data
Let’s consider an example where we connect to a web data source.
Suppose you are planning to retire and looking for a place with ample sunshine, low taxes, and good healthcare facilities. Alternatively, you could be a data analyst trying to provide insights to your clients. For instance, you could assist your client who manufactures raincoats in targeting their sales to areas with high rainfall.
Either way, you find a Web resource that has interesting data about those topics, and more:
https://www.bankrate.com/finance/retirement/best-places-retire-how-state-ranks.aspx
Select Get data > Other > Web. In From Web, enter the address.

After selecting OK, Power BI Desktop’s Query functionality starts working to connect to the specified Web resource. It contacts the Web page and retrieves the information, which is then displayed in the Navigator window. The window shows the results found on the Web page, which in this case includes a table and the overall document. Since we’re interested in the table, we select it from the list, and the Navigator window displays a preview of the table.

You have the option to edit the query before loading the table by selecting “Transform Data” from the bottom of the window or simply load the table. If you choose to transform the data, select “Transform Data” to load the table and launch Power Query Editor. The Query Settings pane will be displayed. If it is not visible, select “View” from the ribbon and then “Query Settings” to show it. See below for an example of what it looks like.

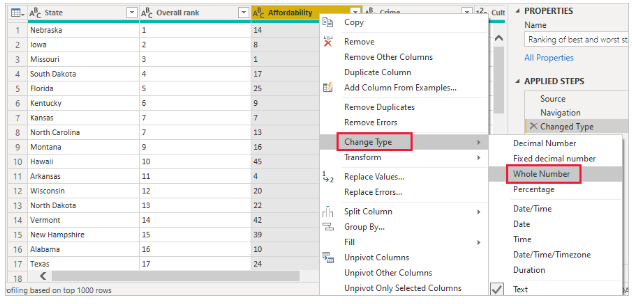
The scores in all columns are currently in text format, but we need them to be in numeric format. To change the format, simply right-click on the column header and select “Change Type” > “Whole Number”. To select multiple columns at once, first select a column and then hold down the Shift key to select adjacent columns, or hold down the Ctrl key to select non-adjacent columns. Once you have selected the desired columns, right-click on any of the column headers to change the format for all selected columns.

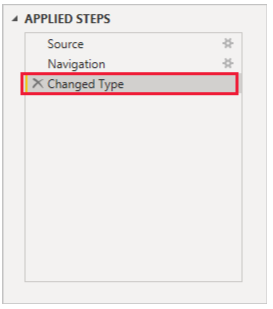
The Query Settings in Power Query Editor display the APPLIED STEPS which reflect any modifications that were made to the data. Any further changes that you make will be recorded in the APPLIED STEPS section as well. You can easily revisit, rearrange, adjust, or delete the applied steps as needed.

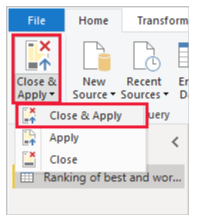
The table can still be edited after it’s loaded, but for now, this will suffice. Select Close & Apply from the Home ribbon, and Power BI Desktop applies the changes and closes Power Query Editor.

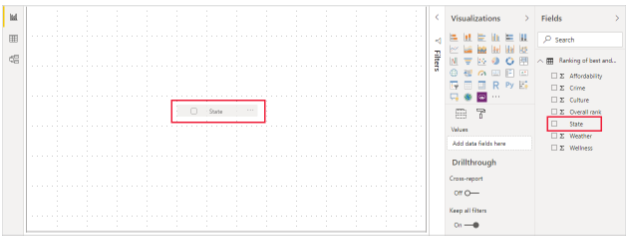
After loading the data model, we can begin creating visualizations by dragging fields onto the canvas in Power BI Desktop’s Report view.

It’s a simple model with a single data connection, of course. A Power BI Desktop report will typically have connections to different data sources, with relationships that produce a rich data model.