
Tableau – Bins Chart
In Tableau, bins are containers of equal size that store data values which correspond to or fit within the bin’s dimensions. Also, bins group data into intervals or sizes of equal size, resulting in a systematic distribution of data. Bins can be created using data from any discrete field in Tableau. The majority of Tableau users create numeric bins using measure fields. Using bins in data analysis is very useful since it provides us with a systematic data range that aids us in organizing our information more efficiently and identifying patterns more effectively.
We cannot use bins in calculations and can only create bins from relational databases. Additionally, when we create bins from measure fields, Tableau saves them as a new field because the bins contain data values in a different format than the original measure field. For example, if we wanted to plot a graph showing sales based on age between 15 and 80. It is possible to create bins for age groups and analyze sales by age group by using the bin functionality. The most common use of bins in Tableau is when creating histograms.
How to Create Bins in Tableau?
To create bins in your Tableau worksheet, follow the steps below:
Step 1: On a Tableau worksheet, right-click on the field name (measure or dimension) from which the bin will be created. Select Create and then click on Bins.
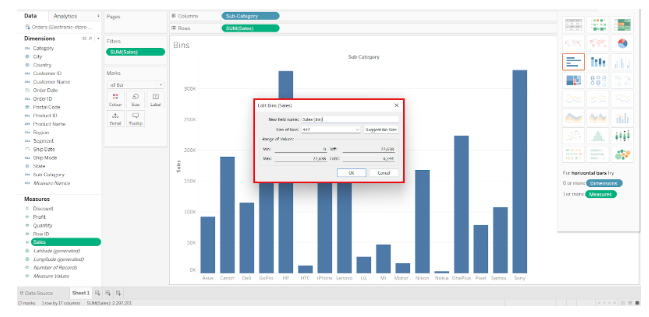
The screenshot below illustrates how we are creating a bin for our measure field Sales.
The Create bins dialog box will open, allowing us to enter details and configure the bin. The next step will provide us with more information about this.


Step 2: In the Create Bins dialog box, we can specify different parameters for the bin we wish to create. The first step is to name the new (bin) field. The next step is to set the bin’s size. Tableau will also suggest a bin size for your selected data set when you click on the “Suggest Bin Size” button.
Additionally, we can set parameters to set a Range of Values, such as Minimum value, Maximum value, Difference, and CntD. When you have entered all the required parameters for a bin, click OK.

Step 3: You can see that the bin we just created with the name Sales (bin) is listed under the Data pane. By dragging and dropping this bin field onto the Columns or Rows section, we can use it in visualization.
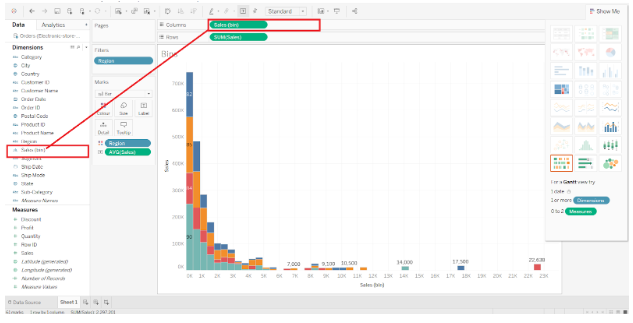

In the screenshot above, we can see that the histogram has a bin field on the x-axis. As a result, the histogram drops values per region in bins of 1000 or 1K. All sales values under 0 to 1000 will occupy the 0K to 1K bin. Values greater than 1K to 2K fall into the next bin and so on. Thus, the entire sales data is segregated or divided into ranges.
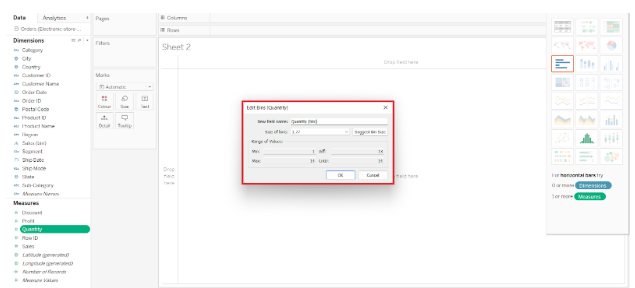
By right-clicking on the bin name and selecting Edit, we can also edit an existing Tableau bin. In this dialog box, you can change any bin parameter according to your needs.

This is how we can create bins in tableau