
Tableau Custom Data View – Drill Down And Swapping Dimension Operations
The commonly used operations in Tableau custom data view are Drill Down and Swapping Dimension operations in Tableau Custom Data View.
With a custom information view, the ordinary information view can be enhanced with additional features so it can display different kinds of diagrams based on the same basic information. For example, you can bore down a measurement field that is part of a predefined pecking order in order to obtain additional estimates at a different level of detail.
The purpose of a custom data view is to extend the standard data view with some extra features so that it can display different types of charts based on the same underlying data. As an example, you can drill down a dimension field within a predefined hierarchy to obtain additional measures at a different level of detail. The following are some of the most frequently used and important custom data views available in Tableau.
By Following the below steps you can drill down the data in tableau :
Drill Down –
Step 1 : Create a hierarchy, after which we can drill down to granul level.
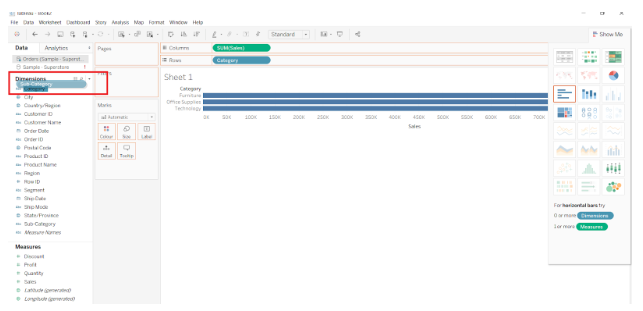
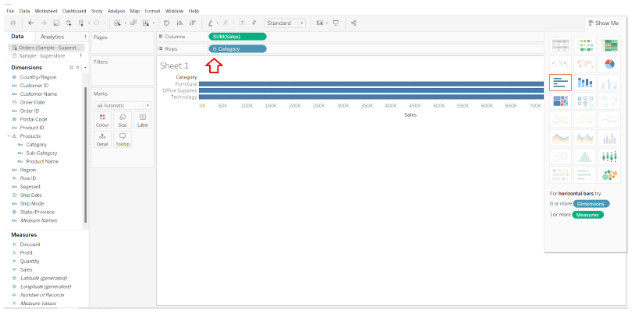
Firstly, we are required to drag and drop sales in columns and category in rows.
As Shown in the image, we must drag sub- category into category to create a hierarchy.

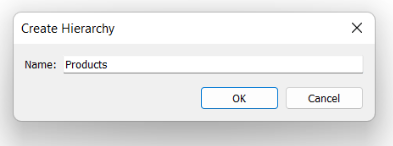
Step 2 : A dialogue box will be prompted, Wherein we are required to give the name of the newly created hierarchy.

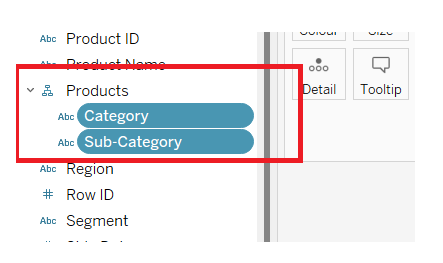
Step 3: As Shown in the below image a hierarchy gets created now along with category and sub-category.

Step 4 : Once you click on the + symbol it drills down the hierarchy, showing data of sub-category.
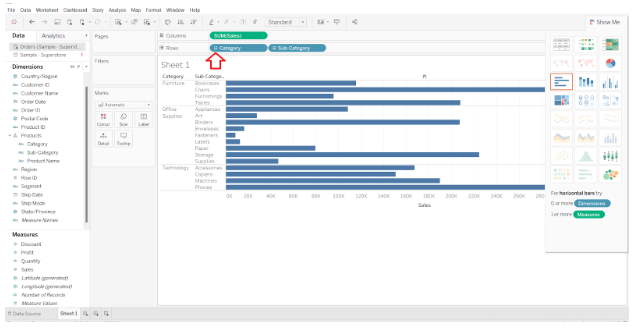

Step 5 : Similarly, by clicking on – symbol you will be able drill up the data. Showing only the Category data.

Swapping Dimensions
A new view can be created by swapping the dimensions in an existing view. The values of the measures do not change, but their positions do. Analyze the Profit for each segment and category of products for each year. By clicking on the vertical line at the end of the category column, you can drag it to the segment column. The screenshot below illustrates this action.
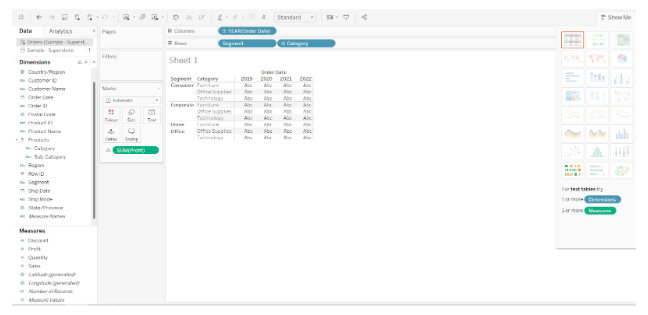

Following is a screenshot of what happens when the dimensions are swapped. For each category and segment, only the position of the measure Profit changes, not the value.


Thus, this is how we can swap the dimensions and drill down in tableau.