
Navigation in Tableau
Tableau is a Business Intelligence tool used for data visualization. One of the unique features of this platform is that it allows for real-time data collaboration and data blending. Using Tableau, users can connect databases, files, and other big data sources and create a shareable dashboard. Researchers, professionals, and government organizations primarily use Tableau to analyze and visualize data.
Tableau’s top menu contains numerous buttons. These buttons are called navigational buttons. In this tutorial , we are going to discuss the navigational features/buttons present in the Tableau interface. The main navigational features are :
- File menu
- Data menu
- Worksheet menu
- Dashboard menu
- Story menu
- Analysis menu
- Map menu
- Format menu
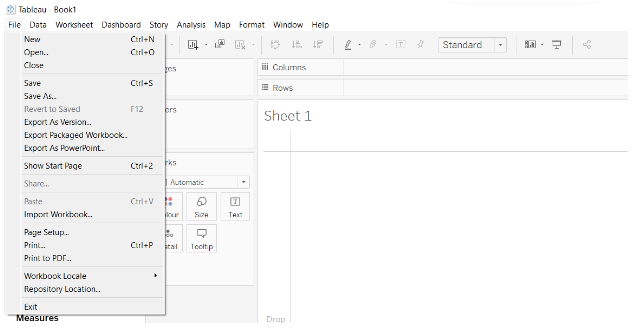
File Menu
In Tableau, you can create a new workbook by selecting the File menu. In addition, it can be used to open existing workbooks on the local system as well as on Tableau’s server. The main features of the File menu are –
- New: It is used to generate a new file.
- Open: Allows you to open previously saved file
- Save: As the name suggests, it will save the file.
- Workbook Locale: Using it, you can set the report’s language.
- Paste Sheets: This tool is used to copy sheets from one workbook and paste them into another.
- Export Packaged Workbook: A packaged workbook can be created and shared with other users using this tool.
- Page setup: A page is set up using this tool.
- Print and print to PDF: This will make it easier to print the workbook.

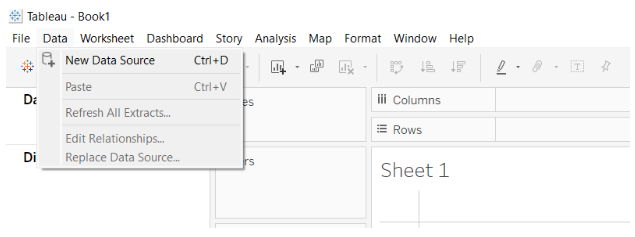
Data Menu
By using the Data Menu, it is possible to create a new data source for the purpose of analyzing and visualizing the data. With the help of the Data menu, the user can replace and upgrade the existing data source. Data menu features include the following:
- New Data Source: This tool allows you to view and select from all available connections.
- Refresh All Extracts: This method refreshes the source data, as its name suggests.
- Edit Relationships: This field is used to define the fields in multiple data sources that need to be linked together.
- Replace data source: It is used to characterize the fields which have more than one information hotspot for connection.

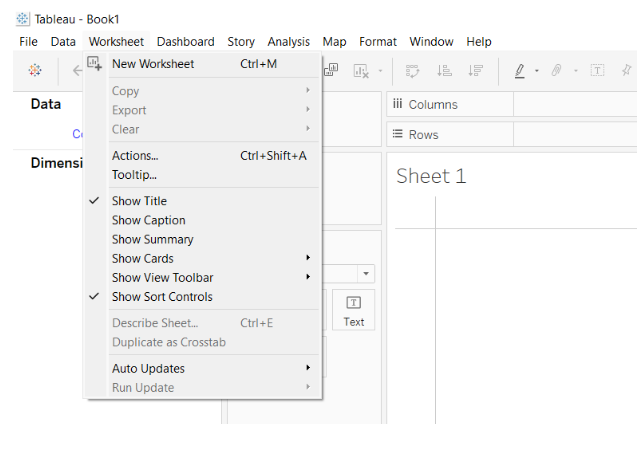
Worksheet Menu
With the Worksheet Menu, you can create a new worksheet as well as access various display options, such as showing the title and captions. In the Worksheet menu, you will find the following features:
- New worksheet:This function generates a new worksheet.
- Show Summary: It shows a summary of the data used in the worksheet, as its name implies
- Tooltip: It is used to display a tooltip when hovering over various data fields.
- Run Update: It is used to update worksheet data or any filters that have been applied.

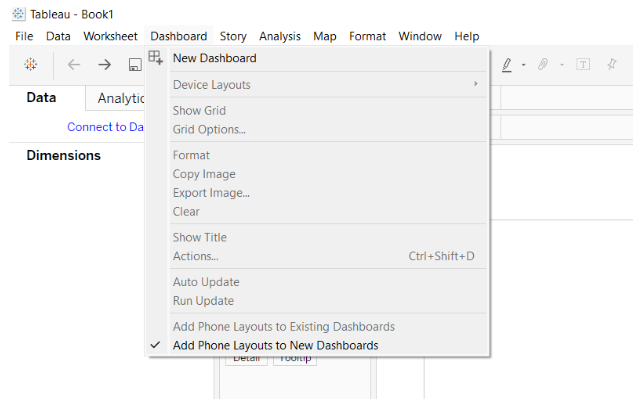
Dashboard Menu
Using the Dashboard Menu, you can create a new dashboard in addition to displaying various display features, such as displaying the title of the dashboard and exporting the image etc. Dashboard menu features include:
- Format: It is used for setting the dashboard layout in terms of colors and sections.
- Actions: This feature allows dashboard sheets to be linked to external URLs or other dashboard sheets.
- Export Image: The Dashboard images are exported using this tool.

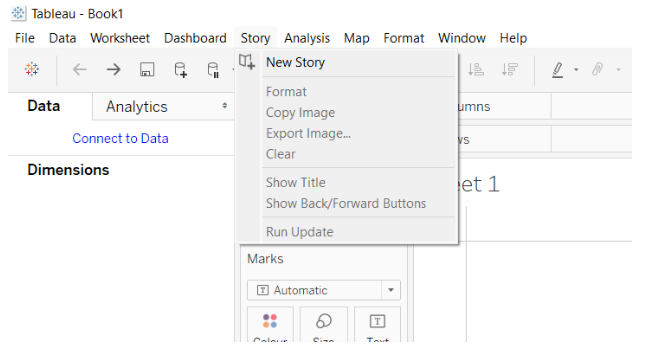
Story Menu
This menu allows the creation of a new story with related sheets and dashboards. Story menu features include:
- Format: It helps set the story’s layout in terms of colors and sections.
- Run Update: It updates the story with the latest data from the data source.
- Export Image: It allows to export the images of the story.
- Show backward/show forward: It is helpful to review older worksheets.

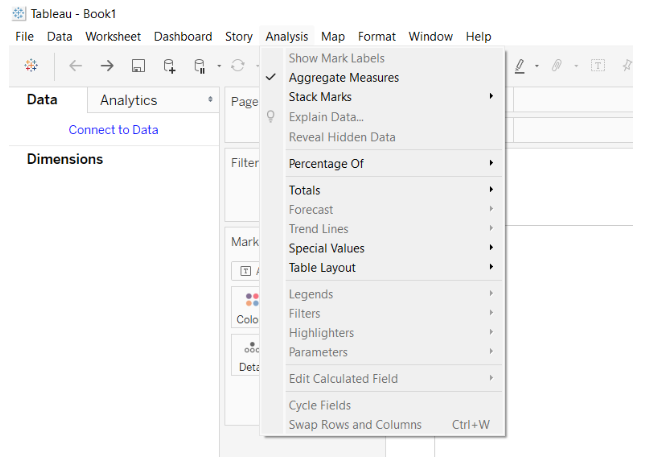
Analysis Menu
A Tableau sheet can be analyzed by using the Analysis Menu. There are many unique features in Tableau, including the ability to calculate percentages and perform forecasts. The main features of the Analysis menu are –
- Forecast:Based on available data, it shows the forecast.
- Trend Lines: It is used to illustrate the trend line of a series of data.
- Create Calculated Field: Based on certain calculations on existing fields, it produces new fields.
- Percentage: The percentage of any given data can be calculated using it.
- Special value: It allows the input of a special type of value.

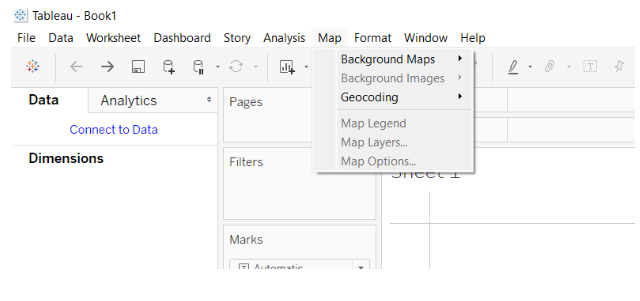
Map Menu
Map Menu is used to create map views in Tableau. A user may assign geographic roles to fields in a given data source. The main features of the Map menu are –
- Map Layers: This feature allows you to hide and show map layers, such as street names, country borders, etc.
- Geocoding: By using this application, new geographic roles can be created and assigned to the geographic fields in the given data source.
- Background image: It is used to set the image in the background.

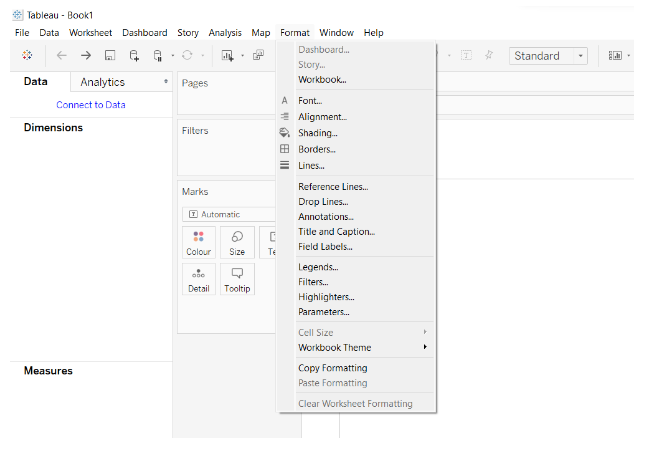
Format Menu
Various formatting options can be applied to the dashboard using the Format Menu. Many features are available, such as borders, colors, text alignment, etc. The main features of the Format menu are –
- Borders: In the report, it is used to form borders around the fields.
- Title & Caption: Reports are titled and captioned using this form.
- Cell Size: Cell sizes can be customized using this option.
- Workbook Theme: A theme is provided for the entire workbook.
- Font: In the workbook, it sets the font.

Conclusion
Thus , these are all the items in the navigation pane of Tableau.