Tableau – Waterfall Chart
What is Waterfall Chart?
Waterfall charts depict a gradual progression of field values from a start value to an end value through successive increments and decrements. Normal running totals do not provide information on the contribution of each category or contributing factor.
In a waterfall chart, however, we can see that the positive values of each category increase the total value, whereas the negative ones decrease it, leading to a resultant value. Analyzing individual elements of dimensions or measures in this way allows an insightful analysis of how they contribute to a total value.
How to Create Waterfall Chart in Tableau?
To create a waterfall chart in Tableau Desktop, follow these steps:
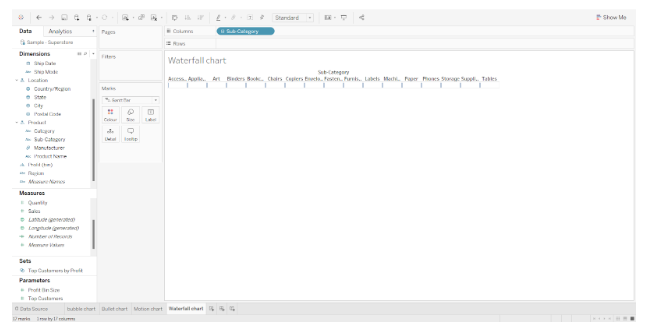
Step 1: Open Tableau Desktop and create a new worksheet
Create a new worksheet in Tableau Desktop. If you haven’t already downloaded your dataset, make sure you do so.
We are using our superstore sales data. Using our data set, we select Dimension; Subcategory and put it in the Columns section.
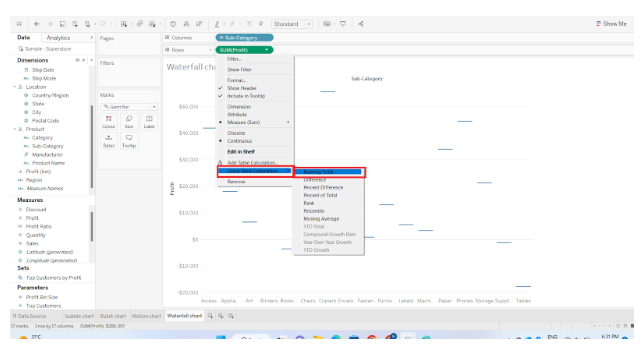
Step 2: Adding Measure Profit and Change Mark Type
In the Rows section, we add a measure Profit.

Our mark type now needs to be changed to Gantt Bar. The Gantt Bar option can be selected from the Marks card drop-down list.

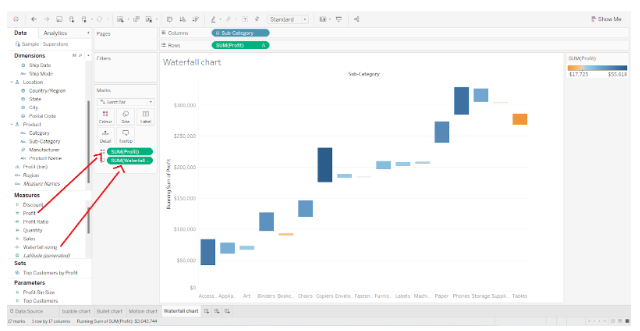
On our plot, we will have individual flat marks as data points. The next step is to set a quick table calculation for SUM(Profit) in the Rows section. The Profit field values are added to a quick calculation that is a running total. By right-clicking SUM(Profit), selecting Quick Table Calculation, and then selecting Running Total, we achieve this.
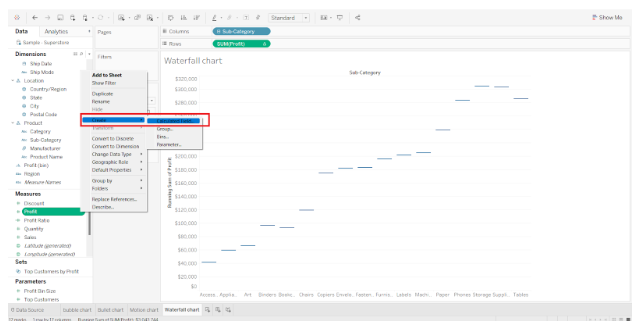
Step 3: Create New Calculated Field
The next step is to create a new calculated field in tableau waterfall chart. You can do this by right-clicking on the measure field, selecting Create, and then selecting Calculated Field.
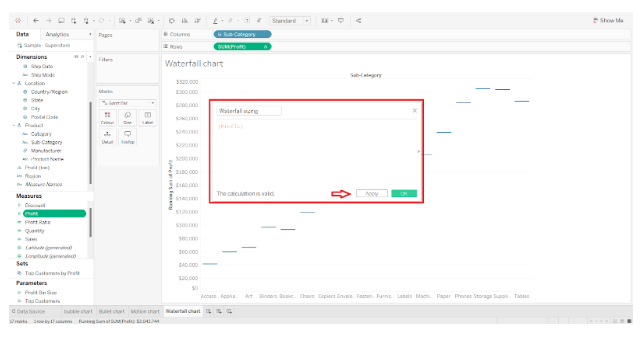
An edit dialog box will open in which we define our field’s condition and click Apply. We enter -[Profit] here, which is negative of profit field values. Additionally, we named the new field “Waterfall sizing”. Add a name and condition according to your preferences.
Step 4: Create Waterfall Bars
We now add Profit to the Color card and Waterfall sizing to the Size card in the Marks section. On the plot, waterfall-like bars will appear instantly.
Step 5: Add Duplicate Measure to Duplicate the Chart
To duplicate the chart, we need to add a duplicate measure field; SUM(Profit). The Rows section shows two fields.

The chart will be duplicated and the editing area will be split into two. In the lower half of the chart, the mark type is set to Gantt Bar.
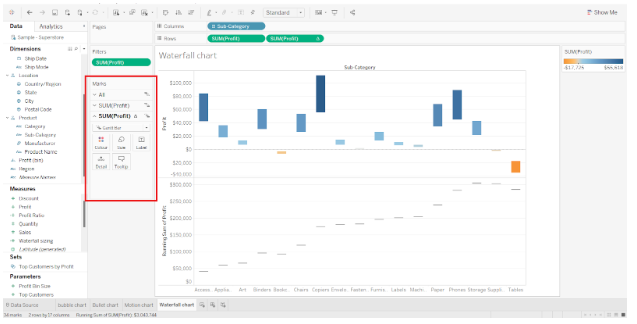
Through Size card, we can also increase or decrease the thickness of the Gantt bars. We now have two plots with the same x-axis and duplicate y-axis. Next, we need to combine or merge these two plots.

Step 6: Combine the two plots into one
Right-click on one of the fields in the Rows section and select Dual Axis from the drop-down menu.
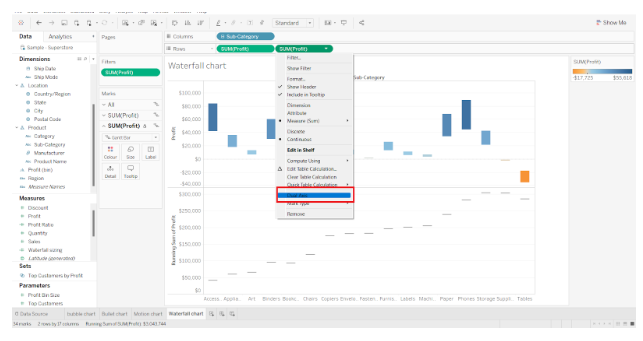
The two plots will be merged into one and the two y-axes will appear on either side of the plot. By right-clicking on the axis and exploring the options, you can format or edit it.
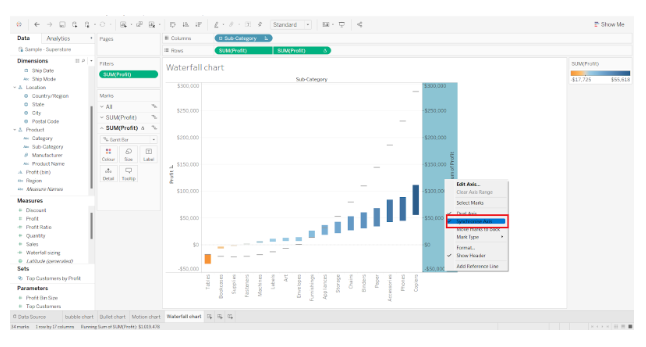
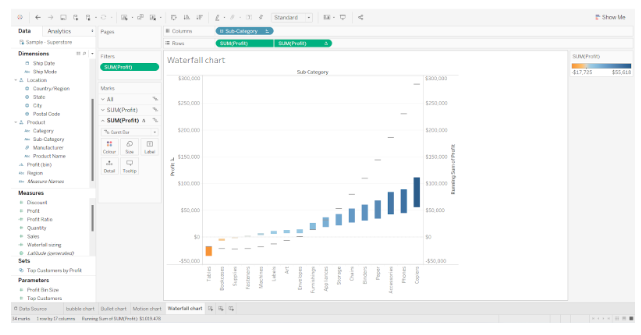
Step 7: A waterfall chart illustrating positive and negative profits
As a result, our waterfall chart is complete.
On the right, there is a reference bar showing the color gradient for-profit values. As we can see, it goes from being orange to dark blue displaying negative to positive profit.
From this, we can understand which sub categories managed to incur most profits and which underwent loss. In this way, waterfall charts prove to be extremely useful in analysis.
Conclusion
This way we can create waterfall charts in Tableau.